P-Value
The p-value:
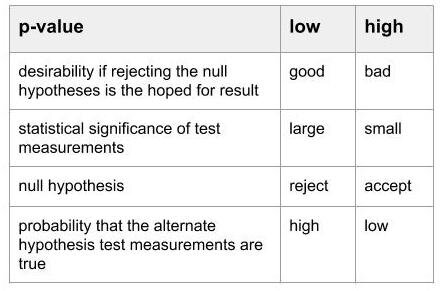
low value supports: H0 (null hypothesis) is False
is the probability of making a Type I error (a False Positive)
is more precisely, the largest probability of obtaining test results at least as extreme as the results actually observed, under the assumption that the null hypothesis is correct
does not measure support for the alternative hypothesis.
can be confusing and difficult to use correctly
the normally desired low p-value result is counter-intuitive
Related Concepts
Important concepts related to the p-value include:
hypothesis - a proposed explanation for an observable fact or event, for example:
a hypothesis that a new therapeutic drug will improve the condition of patients that use it
null hypothesis - ‘nothing happened’, for example:
there’s no difference between the experimental groups and actual population being measured
in testing a new drug, the null hypothesis is that the drug has no effect
null result - a result without the expected outcome, for example:
an experimental result is not significantly different from what is to be expected under the null hypothesis
alternative hypothesis - ‘something happened’, for example":
there is a difference between the experimental groups and actual population being measured
in testing a new drug, the alternative hypothesis is that the drug has an effect
expected probability distribution - a theoretical probability distribution:
as applied to p-value calculations, it is used to estimate the probability distribution of the null hypothesis data points
statistical hypothesis test - a method of interpreting the meaning of data that results from tests of a hypothesis
statistical hypothesis test results - the output from testing a statistical hypothesis
statistical significance - a result has statistical significance when it is very unlikely to have occurred given the null hypothesis
experiment - a procedure carried out to support, refute, or validate a hypothesis
test statistic - a numerical summary of a data-set that reduces the data to one value; commonly used tests include:
z-test - based on a normal distribution
t-test - based on a normal distribution if the value of a scaling term in the test statistic were known
chi-squared test - based on a chi-squared distribution
Confusion Matrix
A Confusion Matrix for null hypothesis (H0) testing is:
Mathematical Equation
The p-value is the probability of seeing an alternative hypothesis effect when the null hypothesis is true. In other words, it is the probability that the measured effect makes it look like the null hypothesis is not true when it is actually the case that the null hypothesis is true.
Summary of Meaning
A Graphical Representation
The illustration below shows P-Value with other relevant elements:
An Example
The example below was calculated using the Statistics Kingdom website:


